Models for Earthquake Prediction


Machine Learning for the Prediction of Magnitude, Depth and Type of Seismic Movement

cracked_earth

Photo by Shefali Lincoln on Unsplash


Overview of Process

General workflow
mag_tree

Data Sources

Data Source Data Type Period Coverage Number of Data Rows
USGS Earthquake Hazards Programs - Spreadsheet Format CSV July 20, 2021 to August 19, 2021 13,323
USGS Earthquake Hazards Programs - GeoJSON Summary Format geoJSON July 20, 2021 to August 19, 2021 13,323

Example of Model Selection

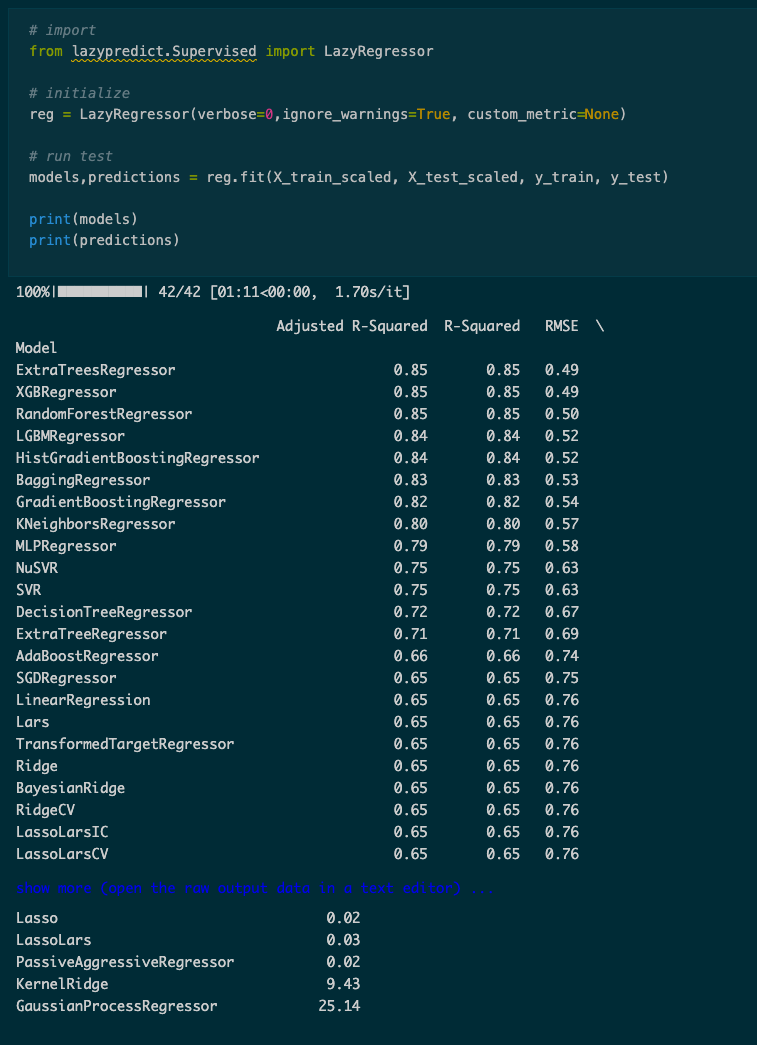
LazyPredict to Identify the Best Models
mag_tree

Data can be fed to Lazy Predict to identify if the data will be a good fit for the models chosen.

Models Used

Random Tree Forest Regressor
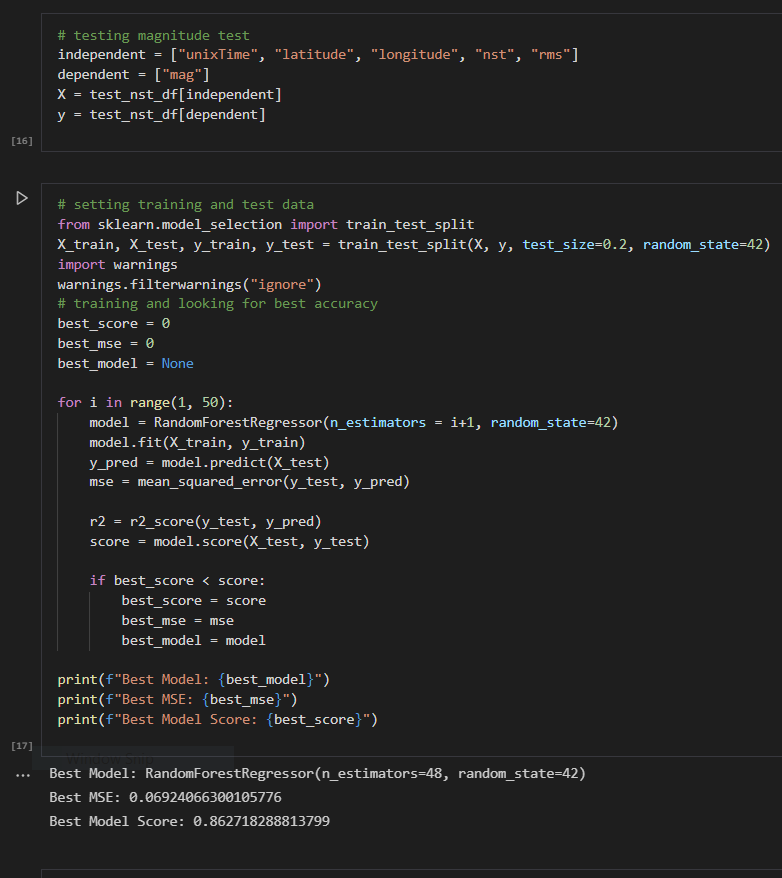
Code Model for Magnitude Prediction

Code used for Random Forest was based on the one found at https://www.kaggle.com/chenzecharya/earthquake-random-forest.
mag_tree
Small Tree Example with Earthquake Data Fed to Model for Magnitude Prediction
mag_tree

Actual model run had 42 estimators and resulted in model score of 0.867 and an MSE of 0.069

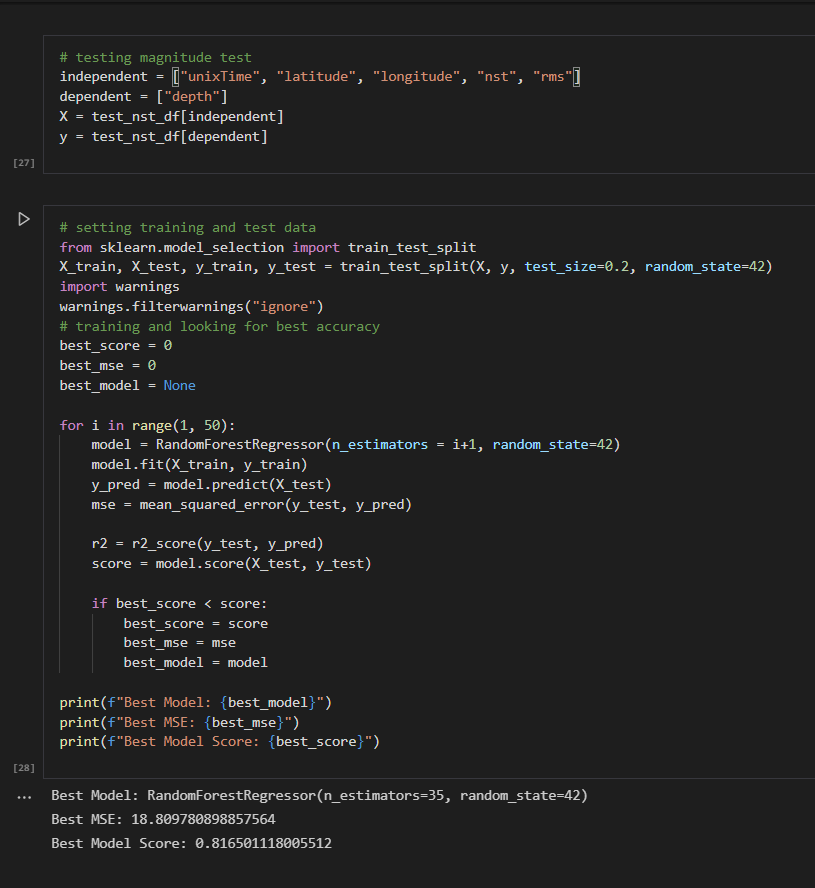
Code Model for Depth Prediction
depth_tree

Actual model run had 35 estimators and resulted in model score of 0.816 and an MSE of 18.80

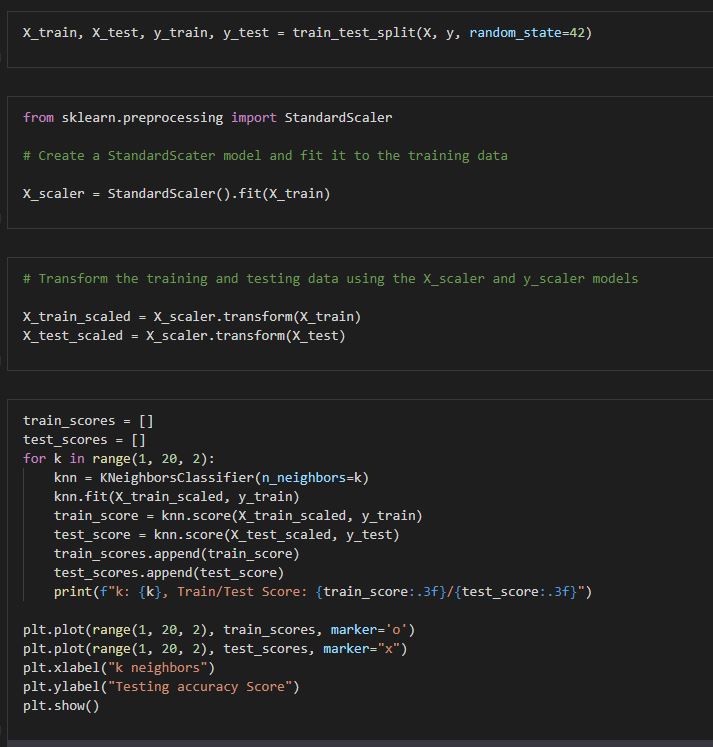
KNN Classifier for Type of Seismic Movement (Earthquake or other type)
Code for KNN Model
knn

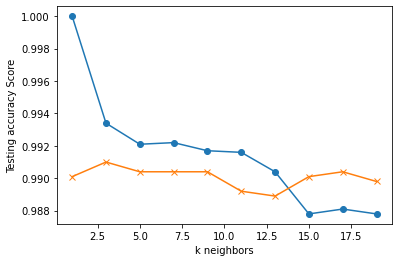
Model used k = 13 and had an accuracy of 0.989

K neighbors vs Testing Accuracy Scores
knn

Model used k = 13 and had an accuracy of 0.989


Tableau Visualizations


Visualization 1: Global Map

All global earthquakes detected in the last 30 days were mapped using latitude and longitude in Tableau Public. Differences in color of the mapped points indicate differences in recorded depth, red being the least deep and blue being the deepest. Differences in size of the mapped points indicate difference in magnitude, with larger points having a larger recorded magnitude.

Visualization 2: Recorded Magnitude vs Reports of Number of Felt Reports

All global earthquakes detected in the last 30 days were mapped using latitude and longitude in Tableau Public. Differences in color of the mapped points indicate differences in recorded depth, red being the least deep and blue being the deepest. Differences in size of the mapped points indicate difference in magnitude, with larger points having a larger recorded magnitude.


Visualization 3: Predicted Depth vs Actual Depth

Predicted and actual earthquakes depths are visualized in this scatter plot with predicted depths on the Y-Axis and actual depths on the X-Axis. There is additionally a color scale of magnitudes with gold indicating the lowest depths and blue indicating the highest depths.

Visualization 4: Predicted Magnitude vs Actual Magnitude

Predicted and actual earthquakes magnitudes are visualized in this scatter plot with predicted magnitudes on the Y-Axis and actual magnitudes on the X-Axis. There is additionally a color scale of magnitudes with orange indicating the lowest magnitudes and blue indicating the highest magnitudes.

Visualization 5: Actual vs. Predicted Earthquake Data

Actual earthquakes in the last 30 and predicted earthquakes (predictions resulting from a Random Forest ML model) were mapped using latitude and longitude in Tableau Public. The top chart reflects actual earthquake locations including depth and magnitude, while the bottom chart reflects predicted earthquake locations including depth and magnitude obtained from the Random Forest model. Differences in color indicate difference in recorded depth, red being the least deep and blue being the deepest. Differences in size of the mapped points indicate differences in magnitude, with larger points having larger recorded/predicated magnitudes.


Conclusions

Based on the predictions generated by both models (KNN and Random Forest), we are confident that they can handle this type of analysis, especially for magnitude and depths. While the amount of data predicted were small, if given enough time and data points, we can train a better model with even higher accuracy that generates more prediction data.

Future projects that can enhance this further would be finding and creating a model that can predict the time and location of future earthquakes. We may require data that we currently do not have, but we can expand upon it if time permits in the future.